Bar chart
An editorial horizontal bar chart (brand tab, headline, measure line, dashed quartile guides) whose bars are scaled from the printed values — one bar in brand colour carries the point.
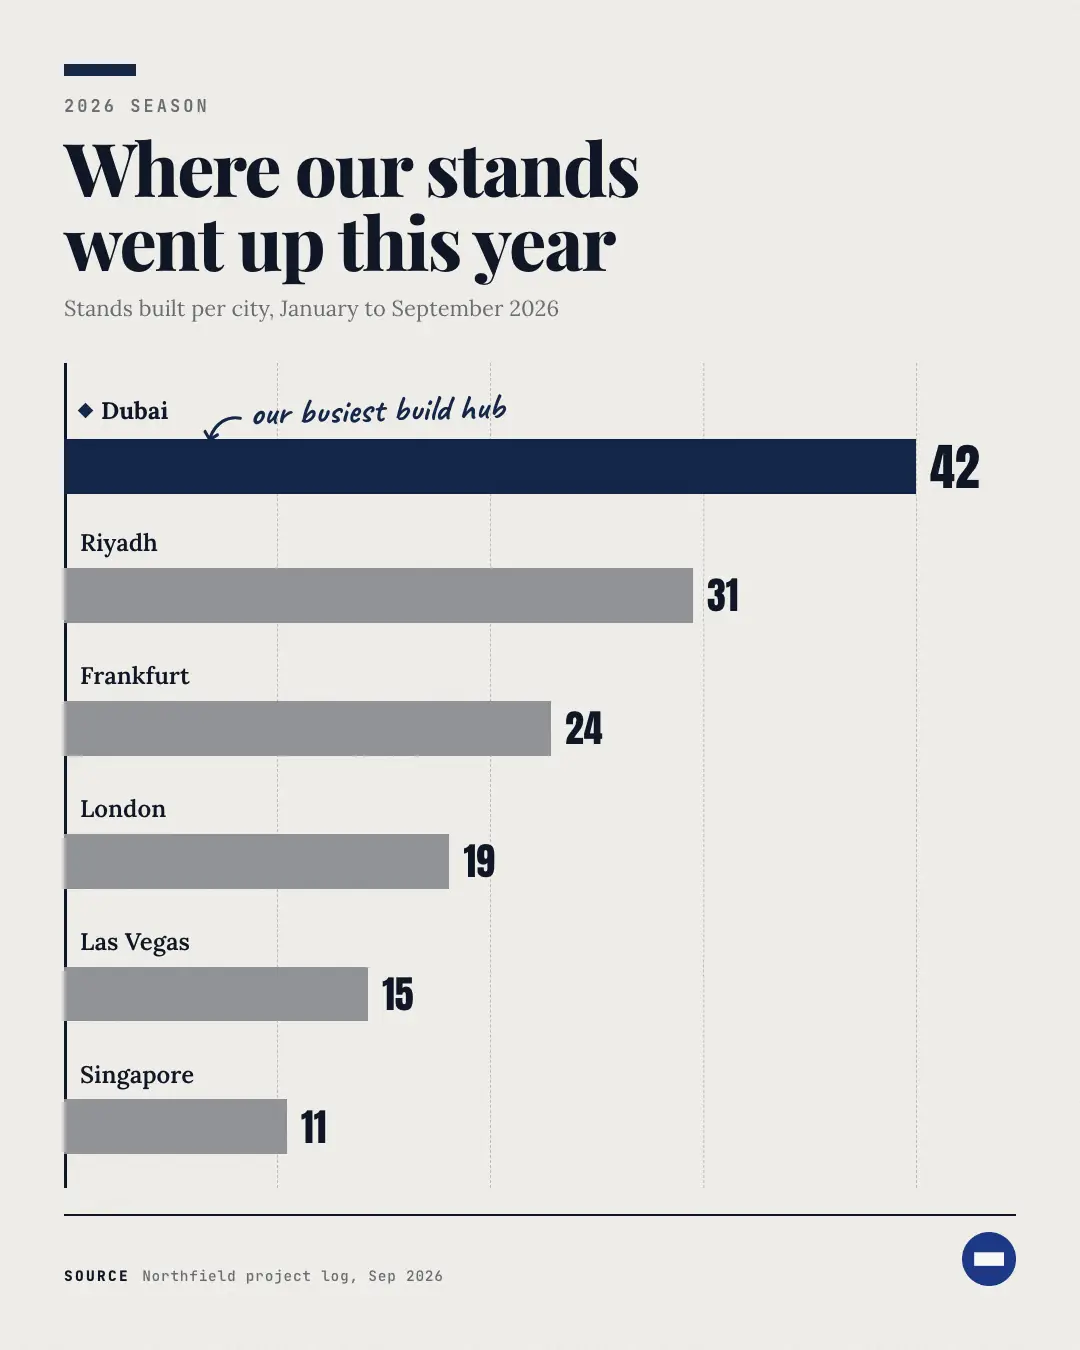
When the AI picks it
MarketiQ’s Creative Director favours the Bar chart for posts that prove a point or teach, when the message is a number, a side-by-side comparison or a list. It is built first to prove a point.
It reads each post’s goal and shape first, then its own words, the platform and the facts you have, and offers this template only where it fits.
Who it’s for
Any business. Nothing in it assumes what you sell, so the Director can offer it to a software company, a café or a coaching centre alike — whenever the post fits.
Platforms and sizes
| Size | Where |
|---|---|
| 4:51080 × 1350 px | Instagram, Facebook, LinkedIn, Threads, Pinterest, Reddit |
| 1:11080 × 1080 px | Ads |
| 9:161080 × 1920 px | TikTok |
| 1.91:11200 × 628 px | Newsletter, Blog |
| 16:91600 × 900 px | X, YouTube |
Single image. Each size is laid out for its canvas, not cropped; the sample above is the 4:5 version.
What it needs
The Director offers it only when these exist. Without them it simply picks another template.
- A real number from your post or your brand facts
Rules the AI follows
Word for word from the template library. The Director follows the copy rules when it writes into the template, and the visual review checks every creative against the visual rules.
Copy rules
- Every value is copied from the source and all bars measure the same thing in the same unit.
- The headline states the finding the chart proves; never add numbers the chart does not show.
Visual rules
- Bars scale from the printed values against a zero line and dashed quartile guides (no invented axis numbers).
- One focus bar in brand colour with a diamond marker; the others in a neutral grey; source and logo below a rule.
More Data & proof templates
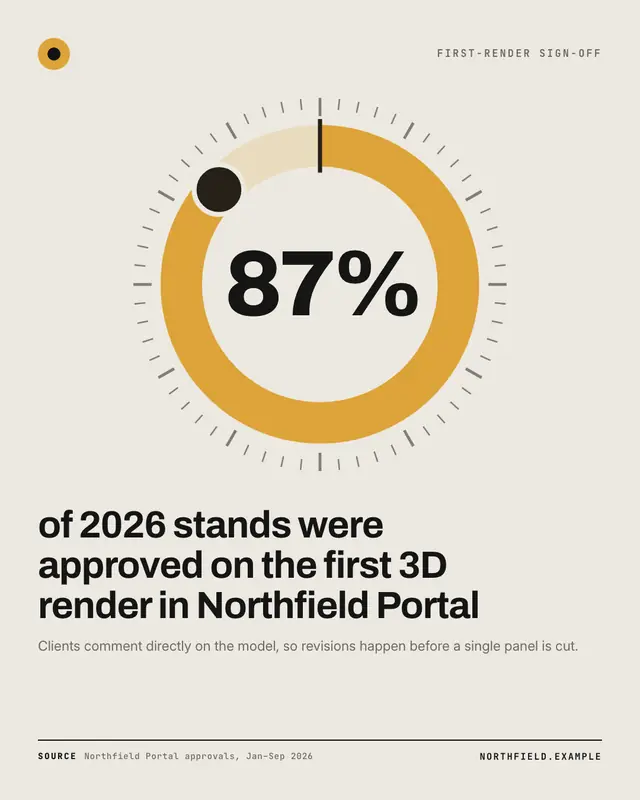
Percentage dial
One real percentage drawn as a brand-colour donut inside an instrument dial (minute ticks, start notch, a knob where the arc ends) with the figure in the centre and the…
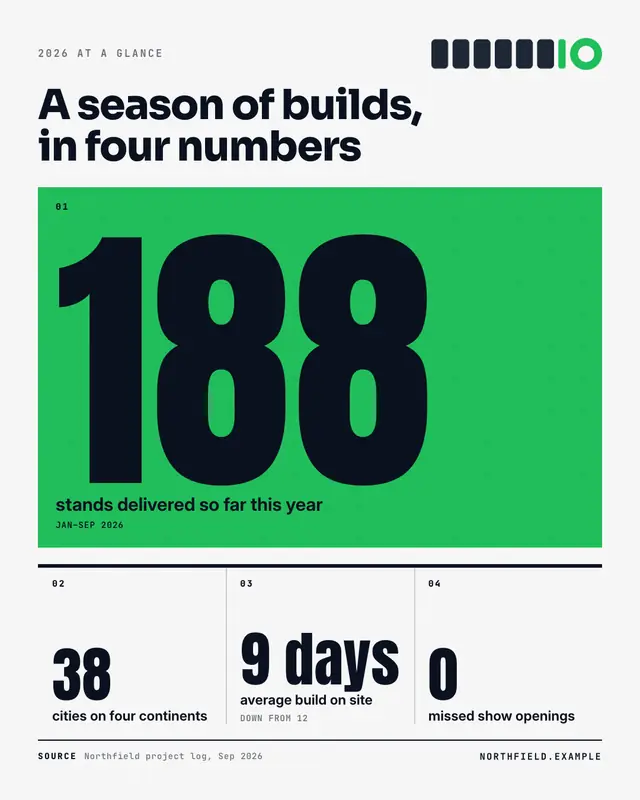
Metric grid
An annual-report KPI page: one hero metric on a brand-colour block, the supporting metrics in ruled editorial columns beneath
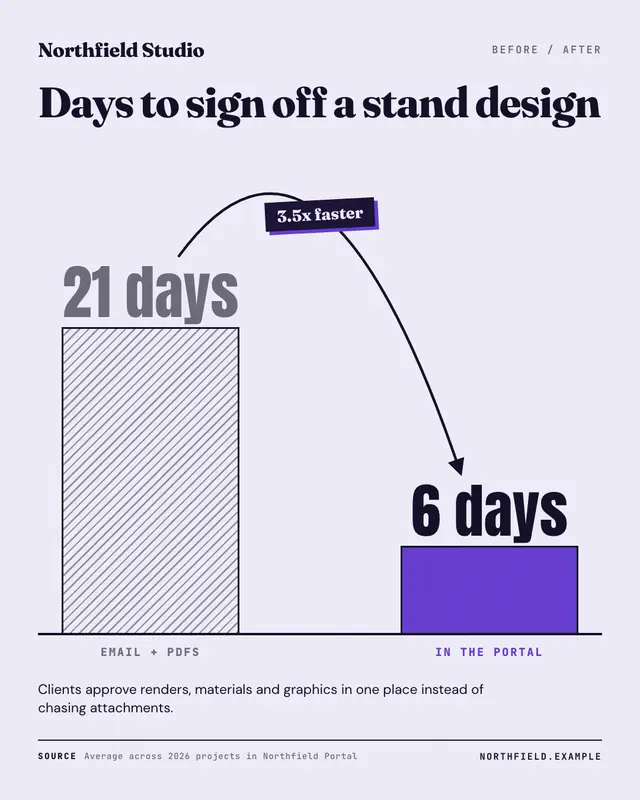
Before / after metric
One metric, two real values: a hatched 'before' column and a brand 'after' column drawn to scale on one baseline, joined by a jump arrow carrying the delta
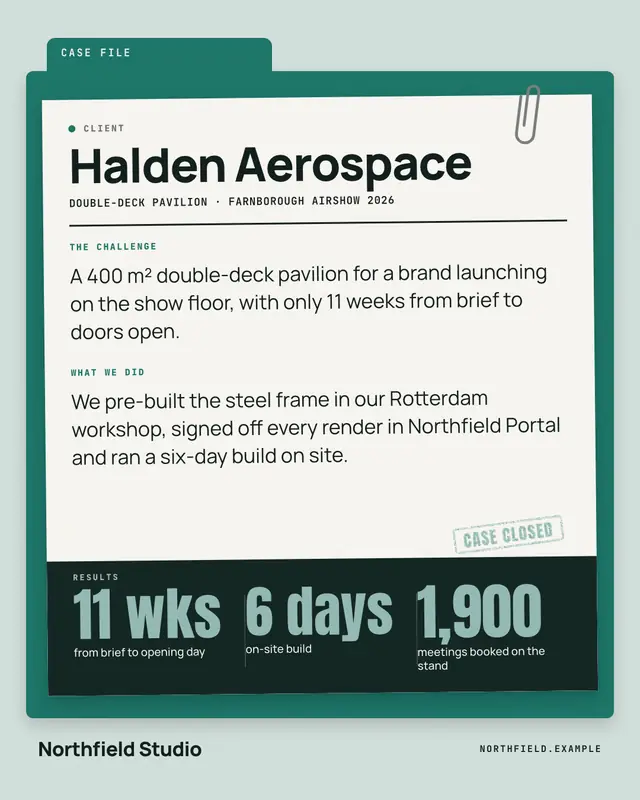
Case file
A case-study snapshot as a real case file: a brand-colour folder with a tabbed label, a clipped sheet naming the client and project, the challenge and what the business…
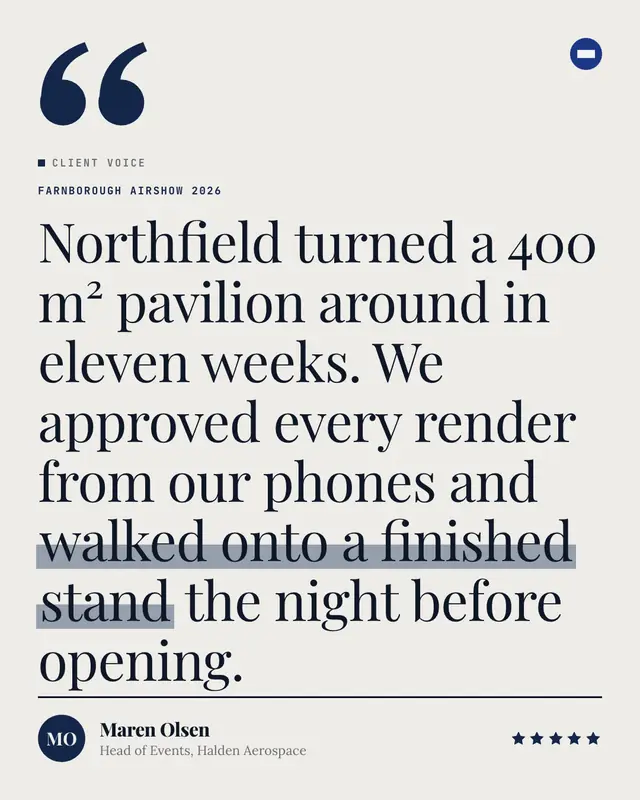
Testimonial
A magazine pull-quote: a hanging brand-colour quote mark, the client's words verbatim in a large serif with the decisive phrase marked like a highlighter, and a signed…
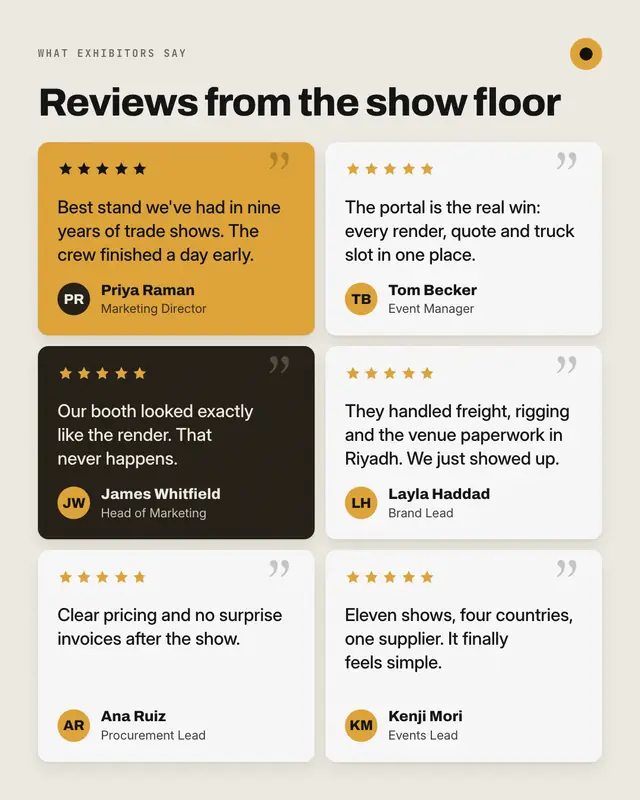
Review wall
A masonry wall of short verbatim reviews
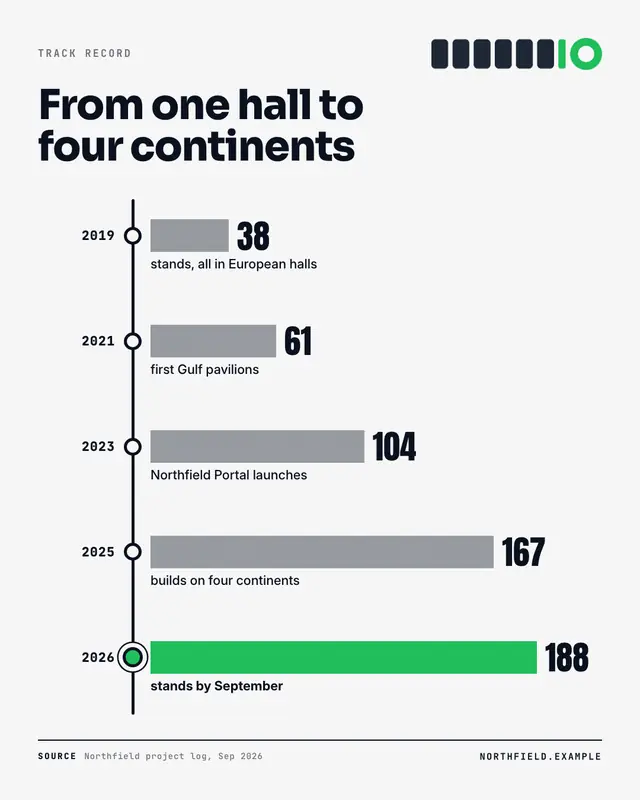
Results timeline
Dated milestones with real values on one track
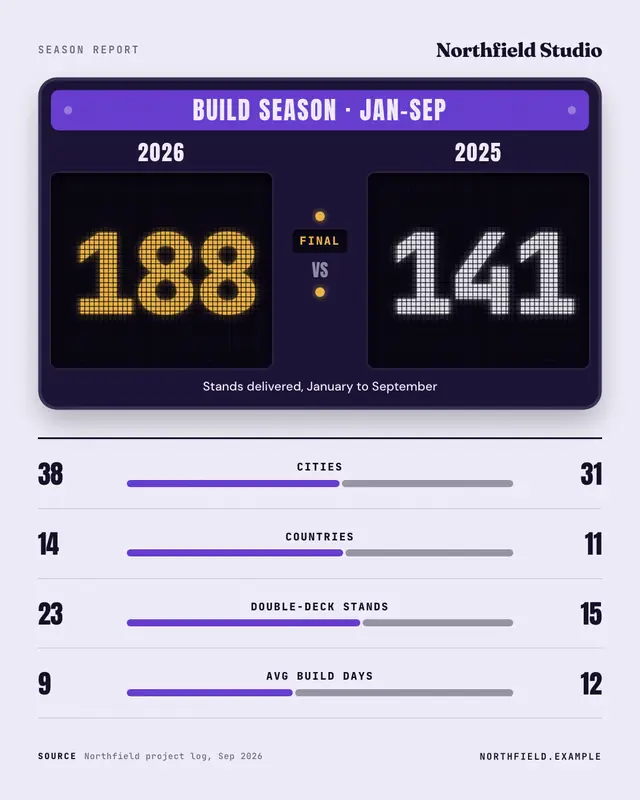
Scoreboard
A stadium scoreboard: brand-plate event title, two sides with LED-pixel scores and a status lamp, then TV-style match stats whose split bars are scaled from both numbers
Make a Bar chart with your brand.
MarketiQ writes the post, picks the template that carries it best — this one, when it fits — and fills it with your logo, colours, facts and copy.