Fishbone diagram
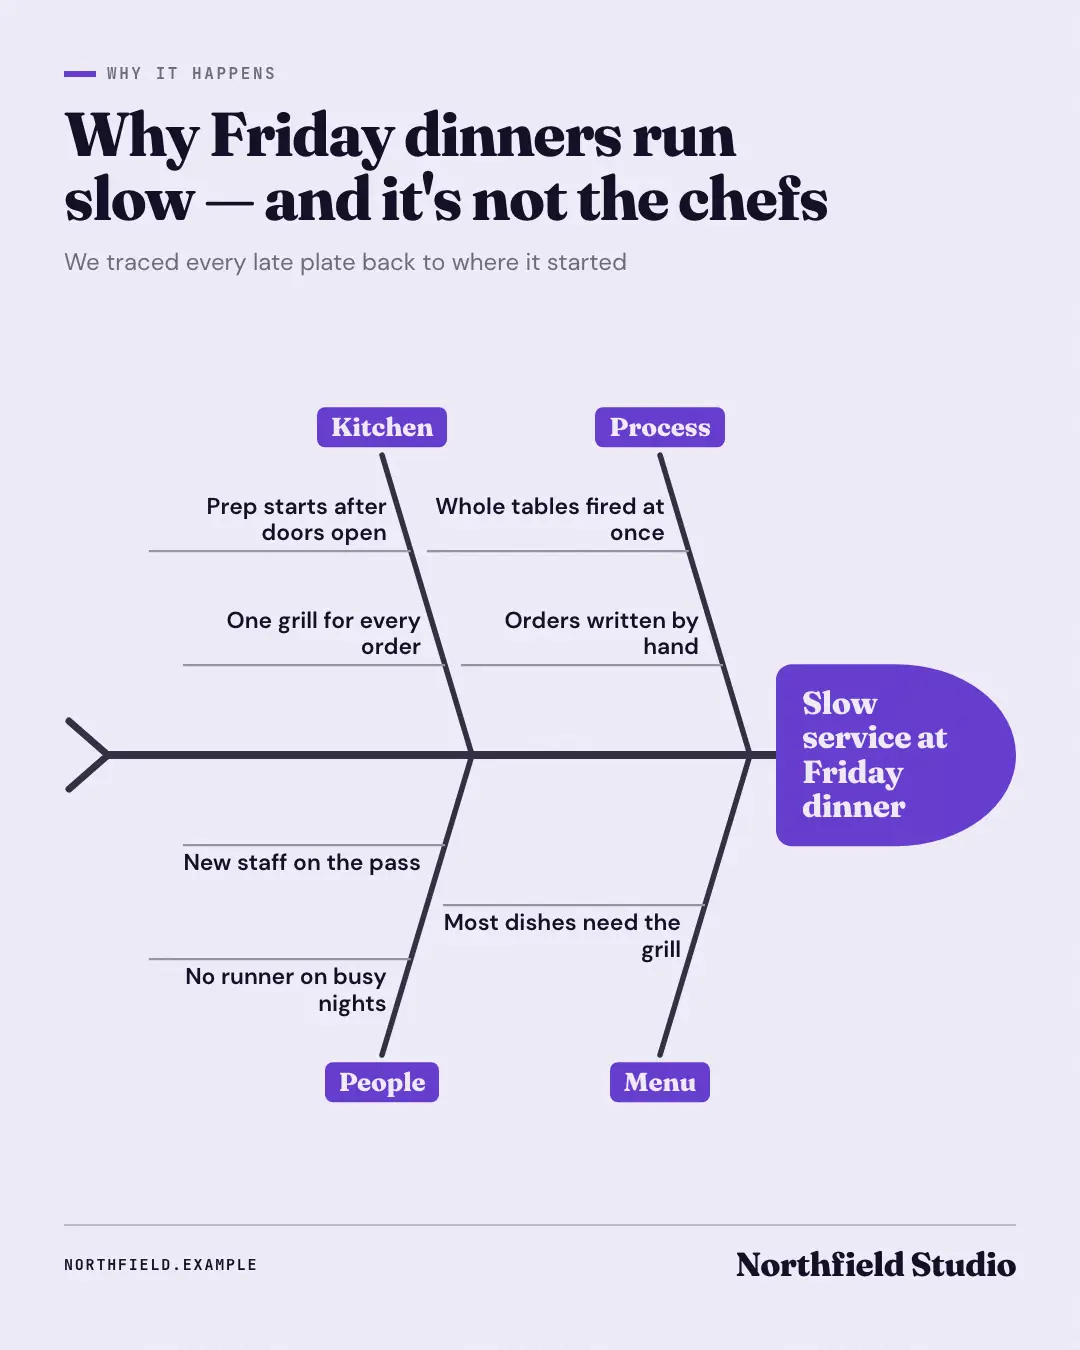
A fishbone diagram (Ishikawa): the problem in the fish's head, a spine running into it and three to six slanted bones — each a family of causes with one or two real causes on its ribs. Why something keeps going wrong, traced back to its 'root cause'.
When the AI picks it
MarketiQ’s Creative Director favours the Fishbone diagram for posts that teach, when the message is a list or one sharp insight. It is built first to teach.
It reads each post’s goal and shape first, then its own words, the platform and the facts you have, and offers this template only where it fits.
Who it’s for
Any business. Nothing in it assumes what you sell, so the Director can offer it to a software company, a café or a coaching centre alike — whenever the post fits.
Platforms and sizes
| Size | Where |
|---|---|
| 4:51080 × 1350 px | Instagram, Facebook, LinkedIn, Threads, Reddit |
| 1:11080 × 1080 px | Ads |
| 9:161080 × 1920 px | TikTok |
| 2:31000 × 1500 px | |
| 16:91600 × 900 px | X, YouTube |
| 1.91:11200 × 628 px | Newsletter, Blog |
Single image. Each size is laid out for its canvas, not cropped; the sample above is the 4:5 version.
What it needs
Only your post. It is made from your copy and your brand kit — there is nothing else to prepare.
Rules the AI follows
Word for word from the template library. The Director follows the copy rules when it writes into the template, and the visual review checks every creative against the visual rules.
Copy rules
- Every label is the post's own words — no invented numbers, scores or percentages.
- The head names one problem; each bone is a kind of cause (people, process, tools…) with causes the post states.
Visual rules
- A horizontal spine from a forked tail into a brand-colour head holding the problem; slanted bones above and below, each capped with a dark category label, causes set on short ribs along the bone.
More Business diagrams templates
Onion diagram
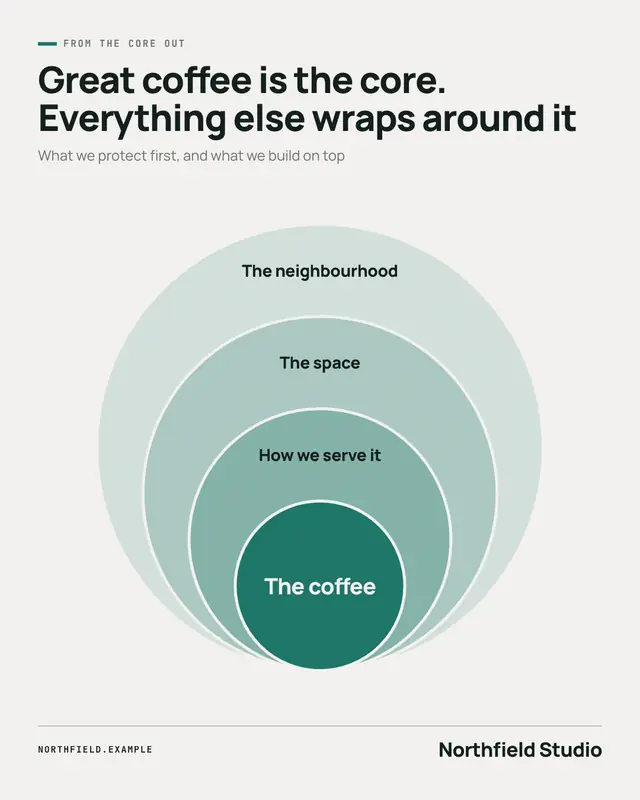
An onion diagram: three or four nested circles resting on one point, the core in full brand colour and each outer layer a paler crescent named in its widest part
Org chart
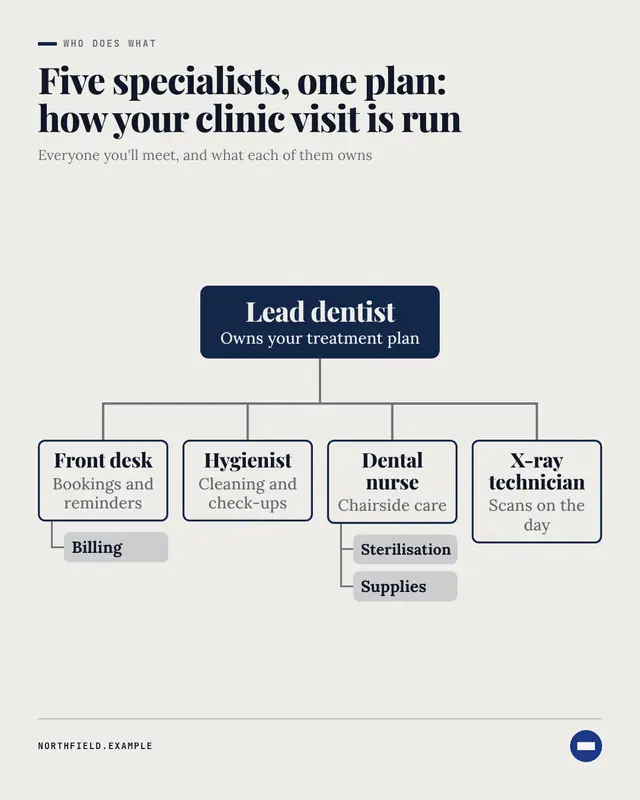
An org chart (an 'organisation chart'): one lead role on a dark plate, a connector branching to two to five roles in brand-edged boxes, each with what it owns and up to…
Pillars
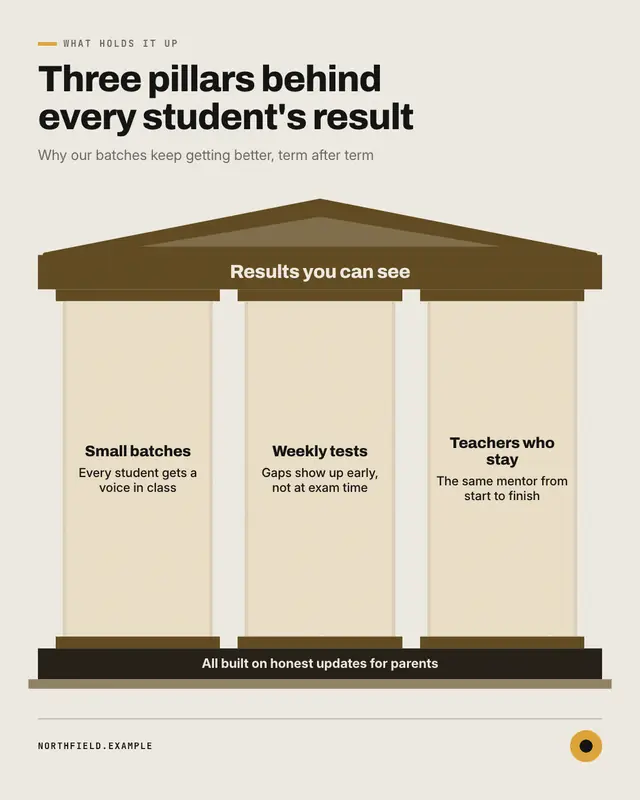
A temple of pillars: the goal carved on the beam under a pediment roof, three to five columns each holding up one thing the goal stands on, and an optional foundation…
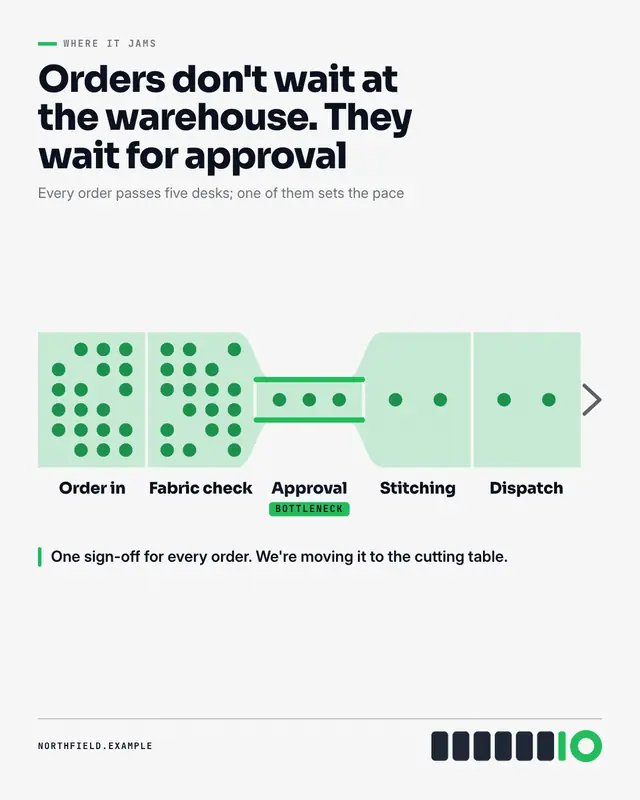
Bottleneck
A bottleneck diagram: the work flows through a pipe of three to six stages, pinched hard at the one stage that holds everything up
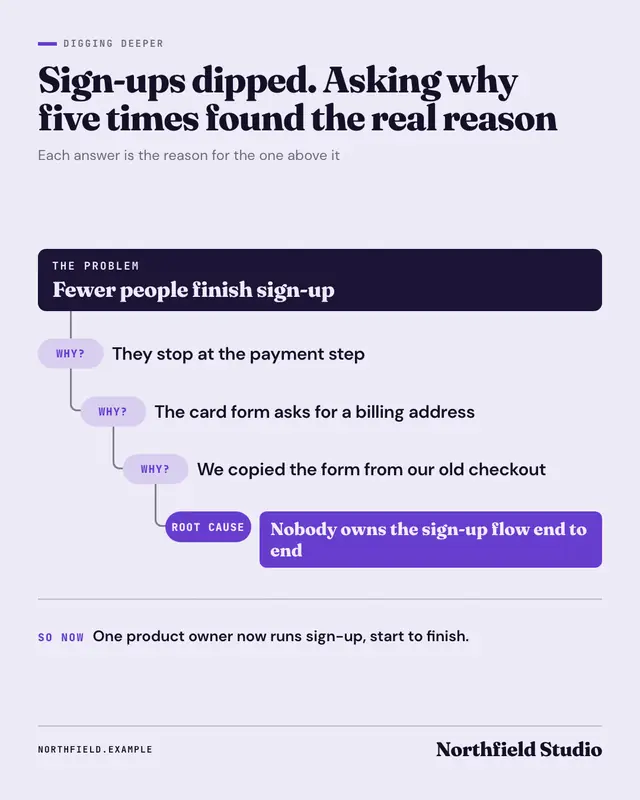
Five whys
Five whys: a problem on a dark plate, then a staircase of 'why?' answers stepping down and in, each answering the one above, until the last lands on the 'root cause' in…
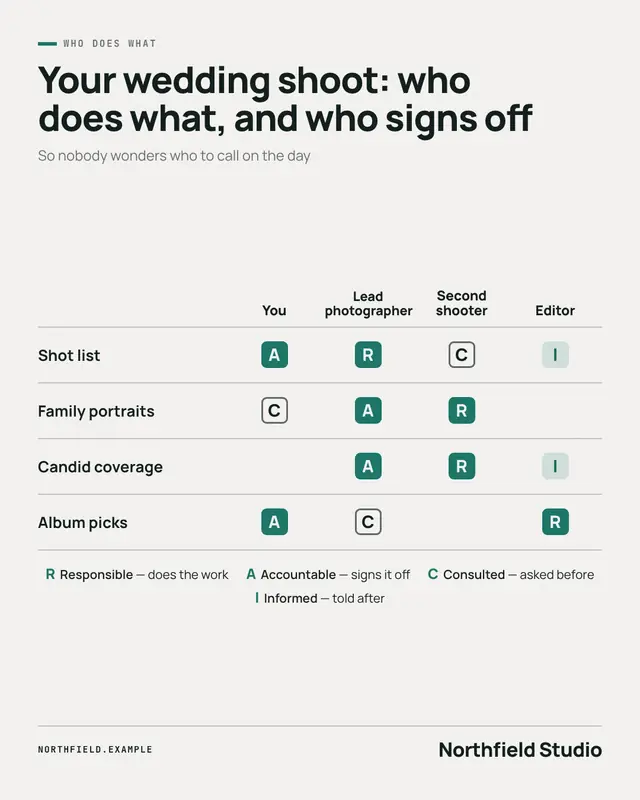
RACI chart
A RACI chart: three to six tasks down the side, three to five roles across the top, and in each cell the role's part as a lettered chip
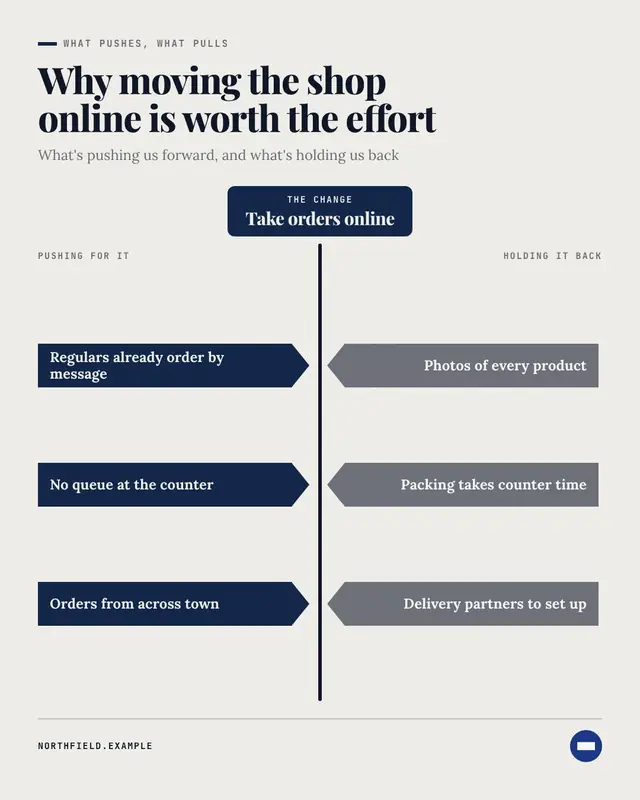
Force field diagram
A force field analysis: the change you want on a dark plate over a centre line, the forces pushing for it as brand arrows from the left and the forces holding it back as…
Line of visibility
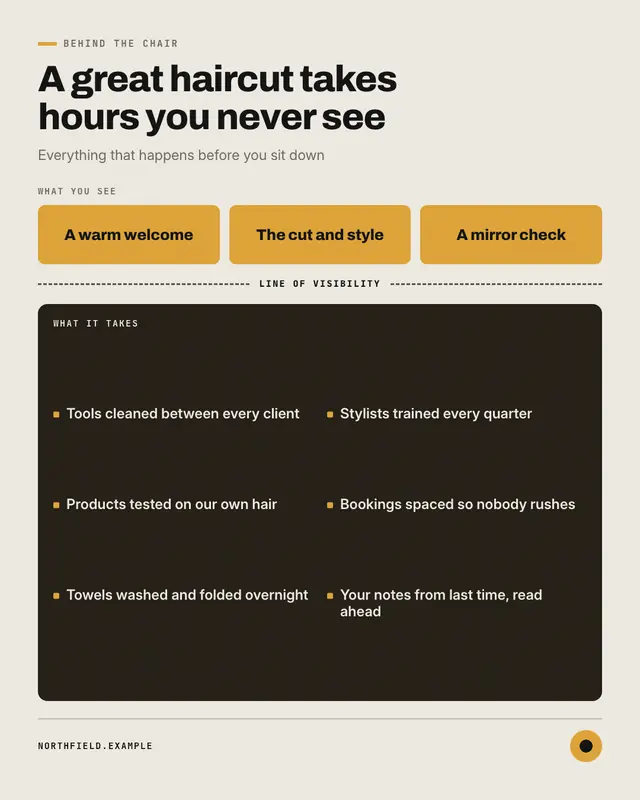
A line of visibility, from a 'service blueprint': what customers see sits in a few bright brand tiles above a dashed line, and the much bigger dark panel below holds…
Make a Fishbone diagram with your brand.
MarketiQ writes the post, picks the template that carries it best — this one, when it fits — and fills it with your logo, colours, facts and copy.