Venn diagram
Two or three overlapping translucent circles in palette tints with crisp coloured rims, each holding its name and up to three short items, and the overlap called out in a brand badge — inside the lens, or on a leader from the centre — so the 'sweet spot' insight is the first thing the eye lands on.
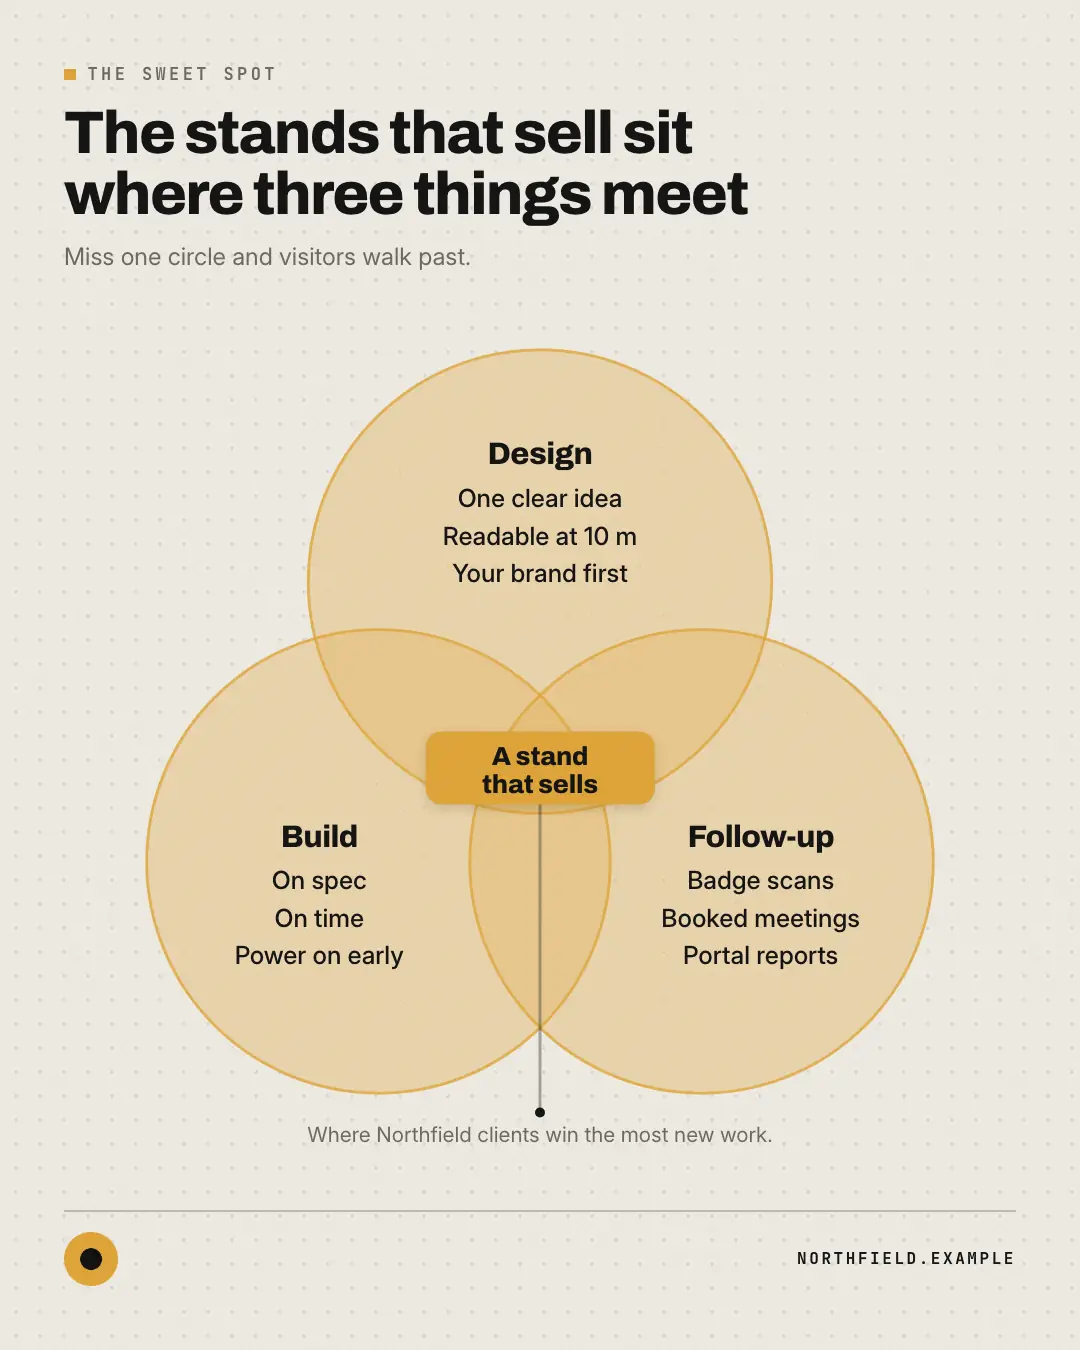
When the AI picks it
MarketiQ’s Creative Director favours the Venn diagram for posts that teach, start a conversation or get people to act, when the message is a contrast (this, not that), a side-by-side comparison or one sharp insight. It is built first to teach.
It reads each post’s goal and shape first, then its own words, the platform and the facts you have, and offers this template only where it fits.
Who it’s for
Any business. Nothing in it assumes what you sell, so the Director can offer it to a software company, a café or a coaching centre alike — whenever the post fits.
Platforms and sizes
| Size | Where |
|---|---|
| 4:51080 × 1350 px | Instagram, Facebook, LinkedIn, Threads, Pinterest, Reddit |
| 1:11080 × 1080 px | Ads |
| 9:161080 × 1920 px | TikTok |
| 16:91600 × 900 px | X, YouTube |
| 1.91:11200 × 628 px | Newsletter, Blog |
Single image. Each size is laid out for its canvas, not cropped; the sample above is the 4:5 version.
What it needs
Only your post. It is made from your copy and your brand kit — there is nothing else to prepare.
Rules the AI follows
Word for word from the template library. The Director follows the copy rules when it writes into the template, and the visual review checks every creative against the visual rules.
Copy rules
- Each circle is a distinct idea in one or two words; items are one to three words and belong only to that circle.
- The overlap label names what you get when all circles combine — the post's point — in a few words.
- No invented facts: circles and items come from the copy or the brand's truth pack.
Visual rules
- Circles are multiply-blended tints of distinct palette colours with full-colour rims; overlaps darken naturally.
- Set text sits inside each circle's own region; the overlap is a brand badge (in the lens, or on a leader).
Truth pack: the verified facts MarketiQ keeps about your business — what you sell, prices, proof and the claims you have approved.
More Infographics templates
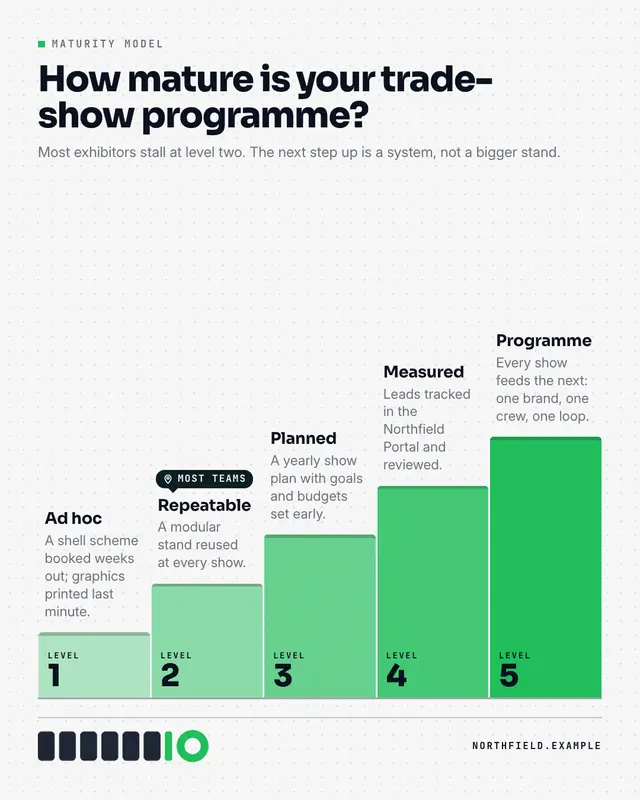
Maturity model
A staircase of three to five levels rising left to right
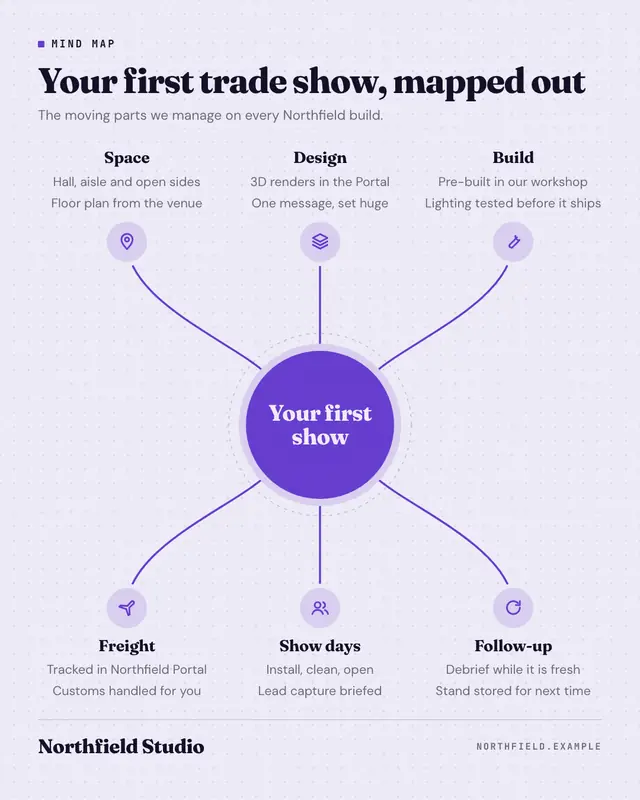
Mind map
A flat-vector mind map: the central idea in a big brand-colour circle, four to six branches sweeping out on smooth curves to tint icon nodes, each with a bold label and…
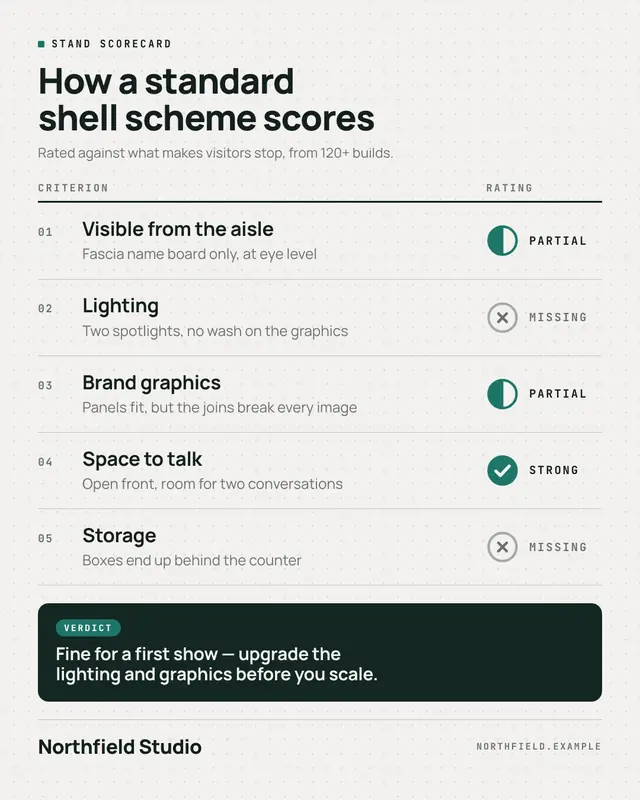
Scorecard
A consultant's scorecard: three to six criteria in ruled rows, each rated with a Harvey-ball mark (full with a check, half, empty with a cross) and the word beside it…
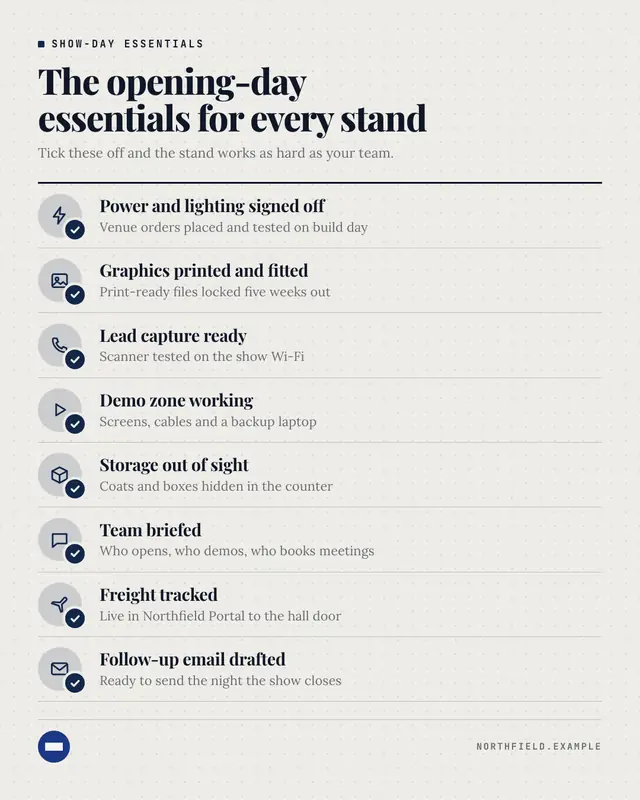
Essentials checklist
An icon checklist of the essentials: each item a tint icon tile with a brand check badge, a bold title and a one-line detail, set in a ruled grid under a header that…
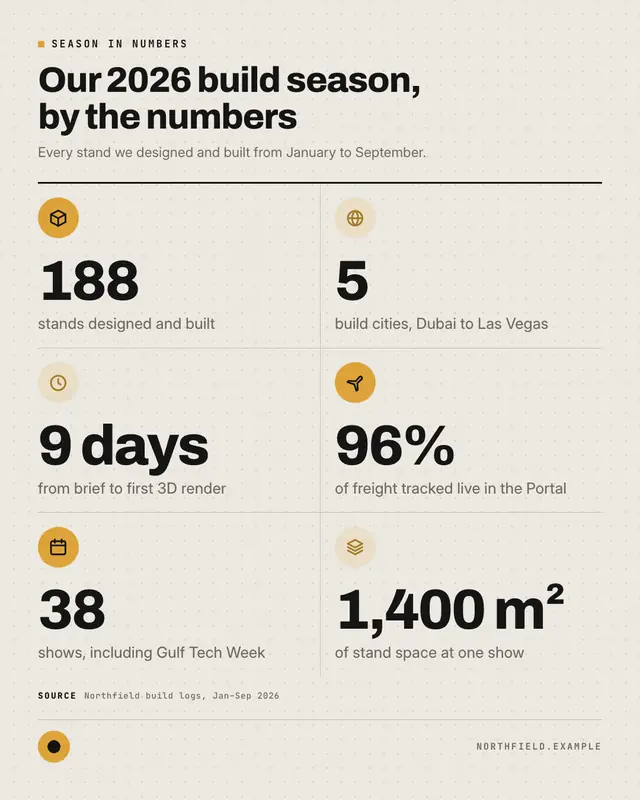
Stat grid
An icon-led grid of three to six equal stat tiles
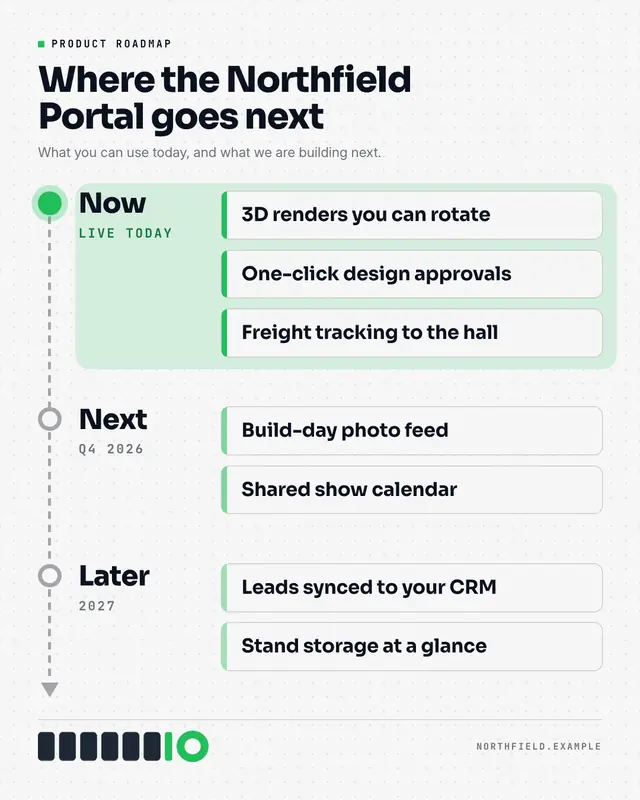
Now / next / later roadmap
A product roadmap board: three or four phases from the copy (Now / Next / Later or quarters) on a time axis with an arrowhead, each holding one to three item cards with…
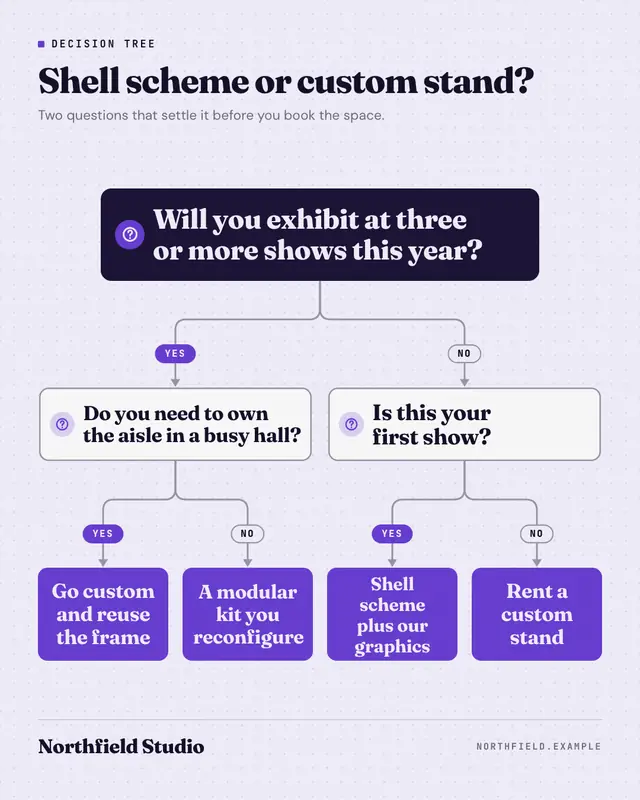
Decision tree
A clean top-down decision tree: a root question on a night card, rounded orthogonal connectors with arrowheads and yes/no pill labels, optional follow-up questions on…
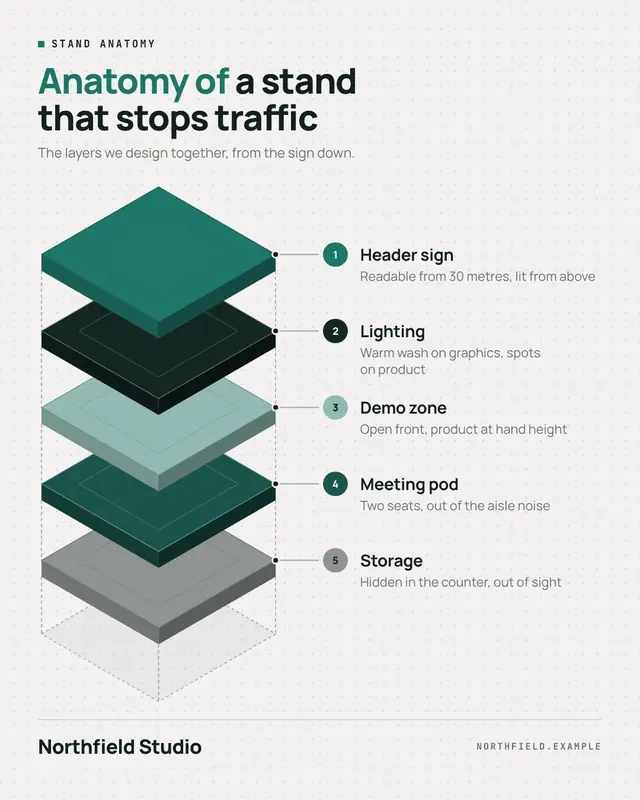
Anatomy of…
An isometric exploded view: three to six layered plates with real thickness in palette colours, floating over a dashed footprint with alignment guides, each called out…
Make a Venn diagram with your brand.
MarketiQ writes the post, picks the template that carries it best — this one, when it fits — and fills it with your logo, colours, facts and copy.